Create, Test, and Deploy a Workflow
End-to-end guide to creating a workflow in Fleak's DAG builder, testing it with sample data, publishing a version, deploying it to a compute cluster, and monitoring its execution.
Overview
A workflow on Fleak goes through a series of stages before it processes production data:
- Create a new workflow and add sample test data
- Build a DAG by adding and connecting processing and sink nodes
- Test the workflow by running nodes against the sample data
- Publish a version to snapshot the current DAG configuration
- Deploy the published version to a compute cluster
This tutorial walks through each stage.
Prerequisites
Before you begin, make sure you have:
- A Fleak account with access to the Workflow Builder
- At least one compute cluster available (you will see the list of available clusters when deploying a workflow)
- Any required credentials or integrations already configured (e.g., S3 Integration, Databricks Integration) if your workflow reads from or writes to external systems
Step 1: Create a Workflow and Add Sample Data
Create the Workflow
- Navigate to the Workflows page from the sidebar.
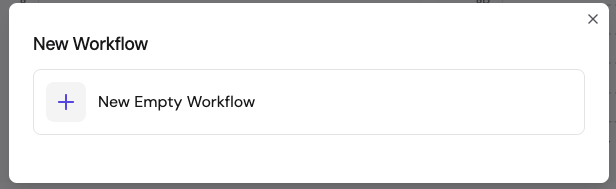
- Click New Workflow.
- Select New Empty Workflow.
Add Sample Test Data
After creating the workflow, Fleak immediately prompts you to add sample test data. This data is used to validate the workflow as you build and helps you create transformation logic.
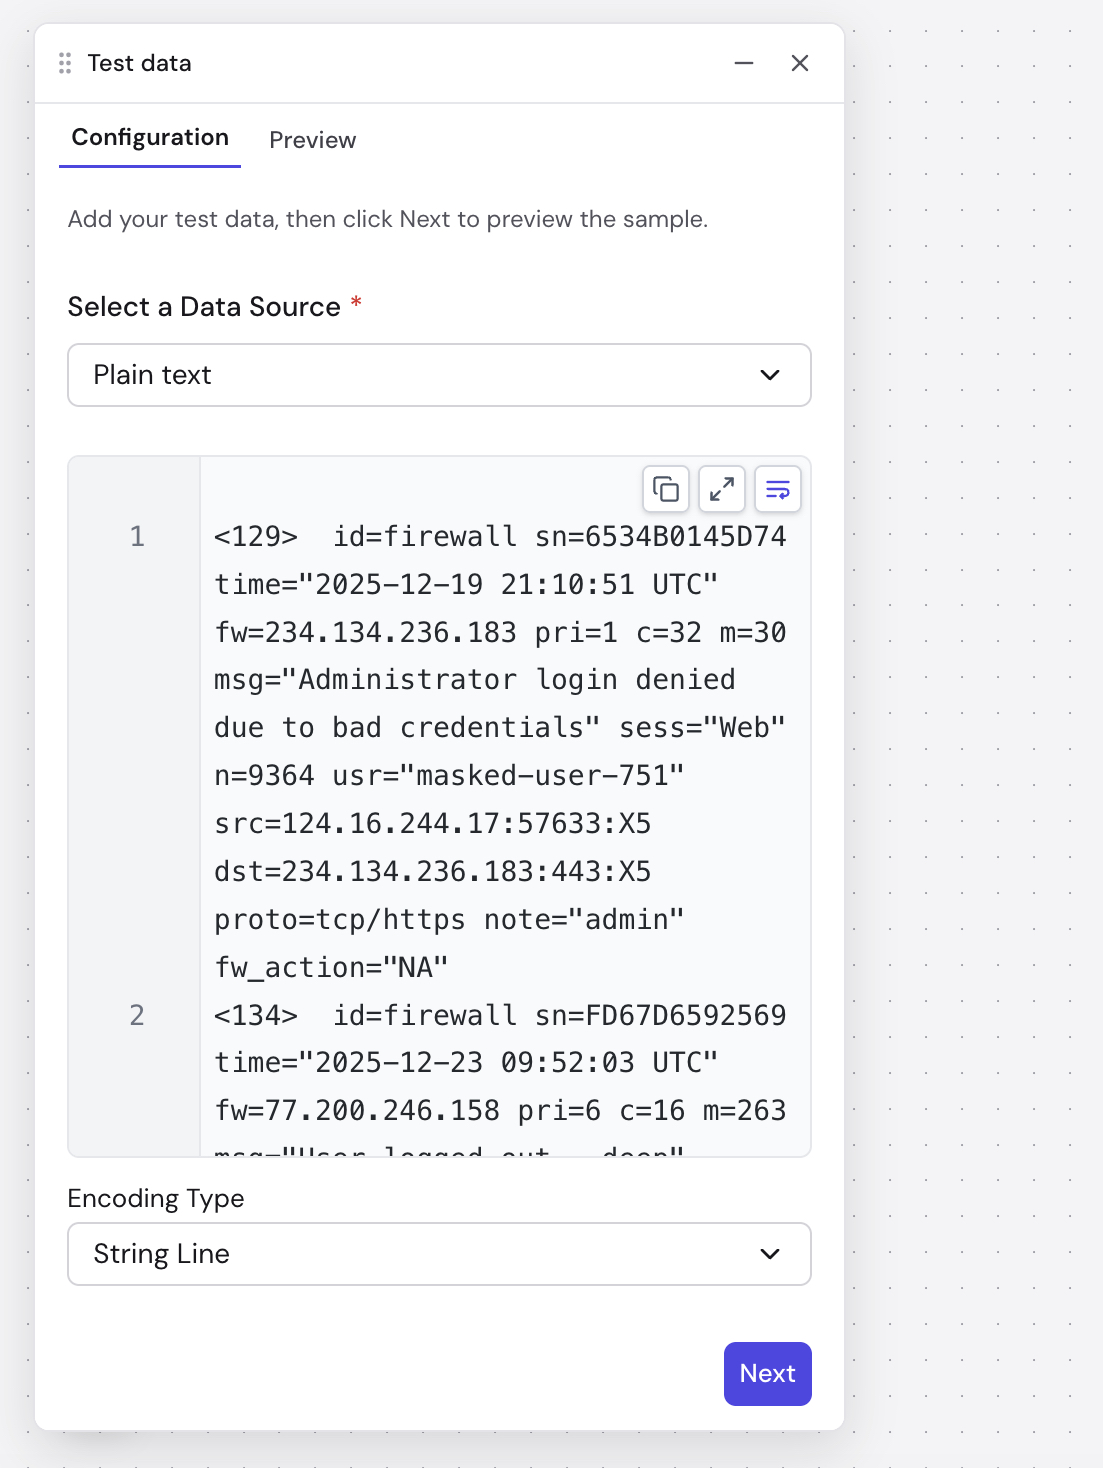
- Paste or type your sample data into the editor. You can also sample data directly from Kafka.
- Select an Encoding type that matches your data format (e.g., String Line, JSON Array, JSON Object, CSV, XML, Text).
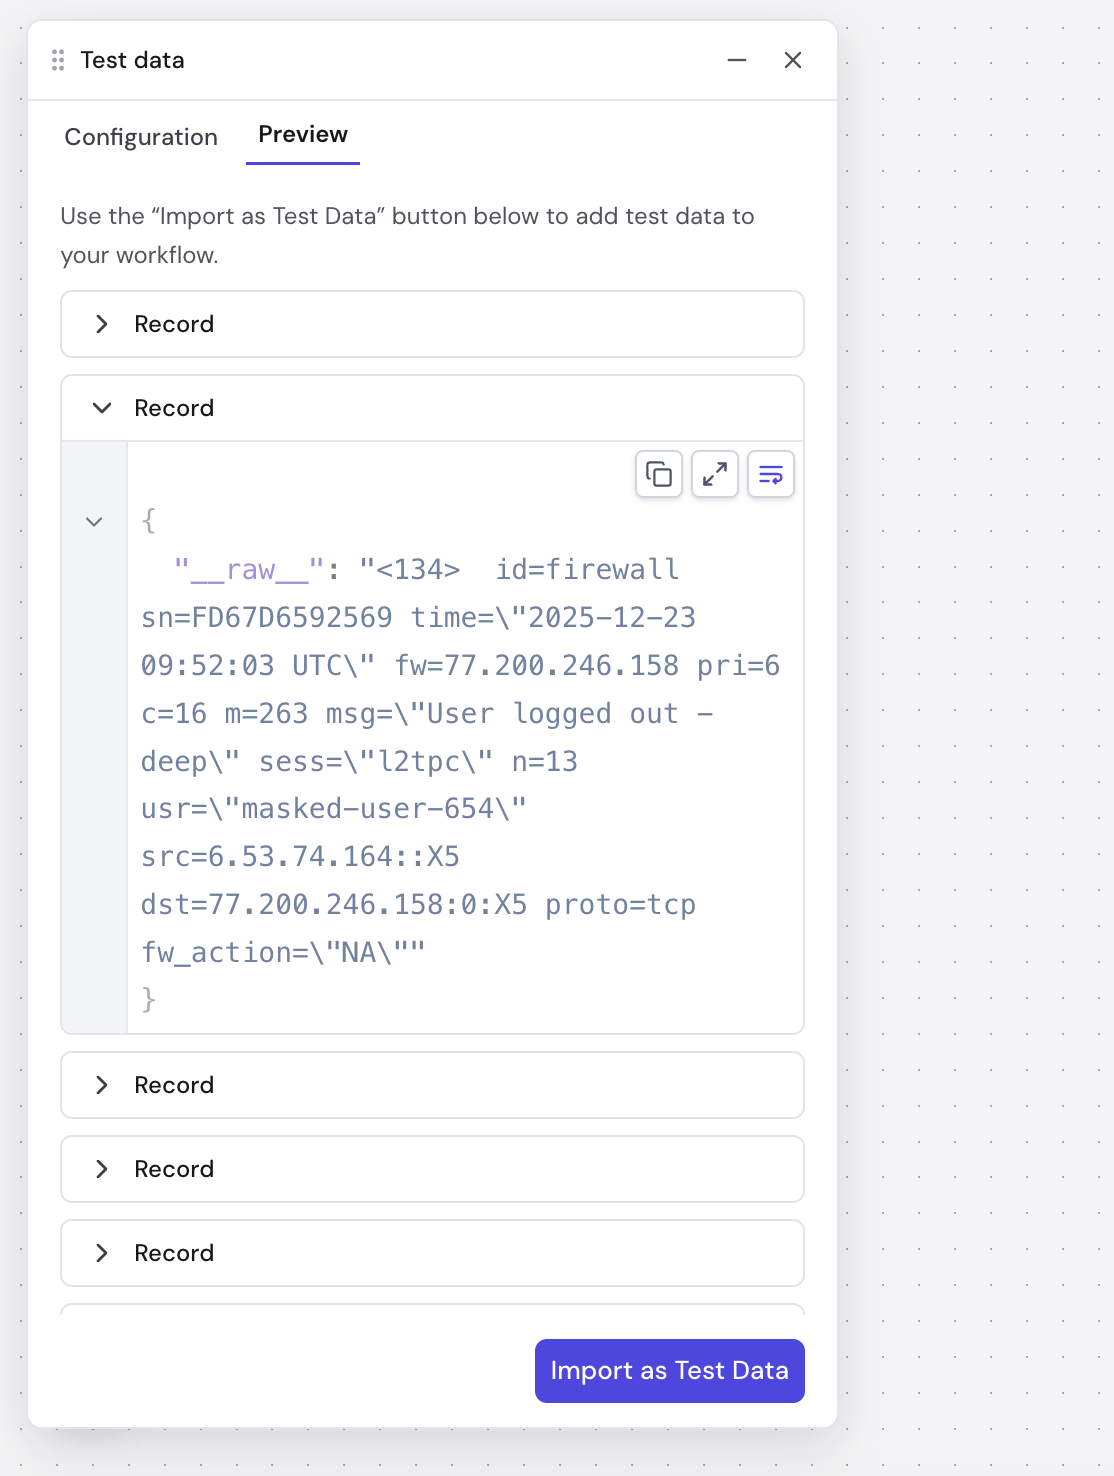
- Click Next to preview the parsed records before importing
- Review the parsed output records in the confirmation dialog and click Import
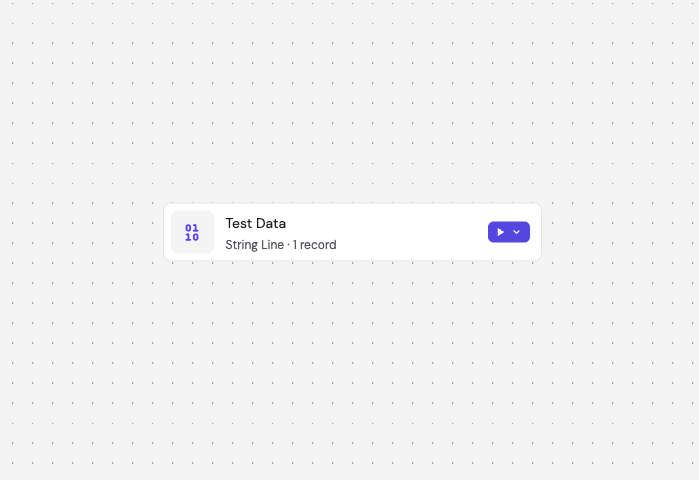
After saving, the canvas displays a Test Data node showing the encoding type and record count. This node serves as the starting point for your workflow.
Step 2: Build the DAG
The DAG builder is a visual canvas where you assemble your data processing flow, starting from the Test Data node.
Add Nodes
Click the node selector to browse available node types:
- Processing nodes — transform and enrich data (e.g., Parser, Filter, Fleak Eval, SQL, LLM Chat)
- Sink nodes — where processed data is written (e.g., Snowflake, S3, Delta Lake, Databricks, Kafka)
See the node reference docs for details on each node type.
Configure Nodes
Select a node on the canvas to open its configuration panel on the right sidebar. Each node type has its own settings — for example, a Parser node requires a parsing format and extraction rules, while a Filter node requires a filter expression.
Connect Nodes
Nodes are connected in sequence to form the DAG. Each upstream node's output becomes the input of its downstream node. The workflow executes nodes in topological order from the Test Data node through to the sink.
Your work is auto-saved as a draft. You can close the browser and return later to pick up where you left off.
You can edit the workflow's name and description at any time from the editor.
Step 3: Test the Workflow
With sample data already configured, you can test your workflow at any point during the build process.
Run Tests
You can test in two ways:
- Run a single node — click the run button on a specific node to execute the DAG up to and including that node. This is useful for debugging intermediate steps.
- Run the entire workflow — click the main Run button to execute the full DAG end to end.
Test runs are limited to 100 records.
View Results
Results appear in the Debug sidebar with three view modes:
- JSON — raw JSON output
- Table — tabular view of output records
- Errors — any errors encountered during execution, shown per node
You can inspect output at each step of the DAG to trace how data is transformed through the workflow.
Step 4: Publish a Version
Once you are satisfied with the test results, publish a version to snapshot the current DAG configuration.
- Click the arrow on the Deploy button to open the dropdown menu, then select Version history.
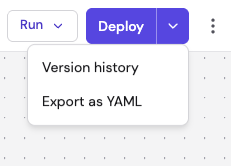
- The Version history panel opens on the right, showing your current edit and any previously published versions.
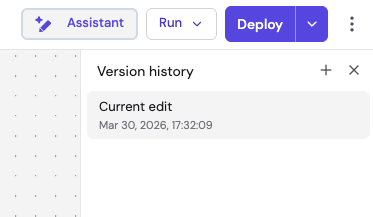
- Click the + button at the top of the panel to add a new version.
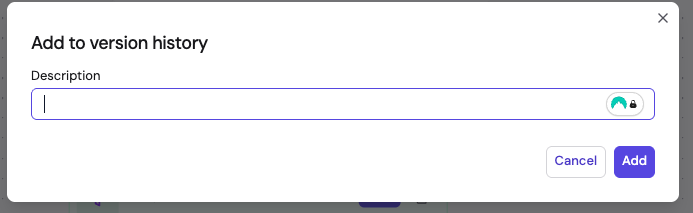
- In the Add to version history dialog, enter a Description summarizing what changed, then click Add.
The version is saved with a unique commit hash. You can view the version history, switch between versions, or clone an older version to create a new edit. Only published versions can be deployed.
Step 5: Deploy the Workflow
Click the Deploy button to open the deployment wizard. The wizard walks you through four steps:
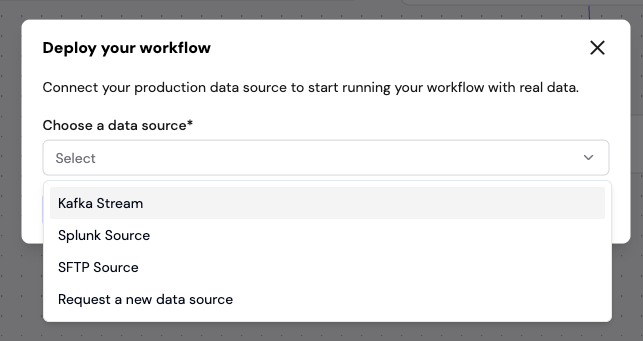
5.1 Select Data Source
Choose the production data source for the deployment:
- Kafka Stream — consume from a Kafka topic
- Splunk Source — ingest from Splunk
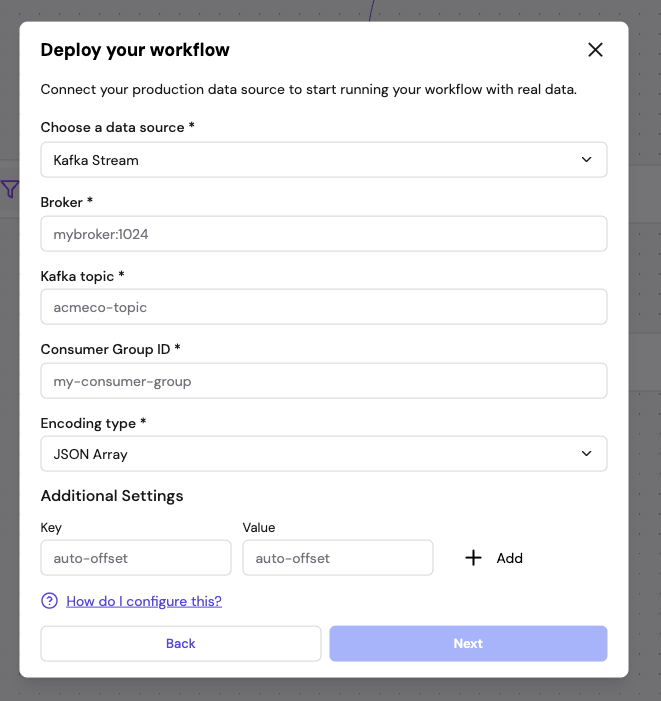
5.2 Configure Data Source
Provide the connection details for your chosen source. For example, for Kafka you configure the broker address, topic, consumer group ID, encoding type, and any additional settings.
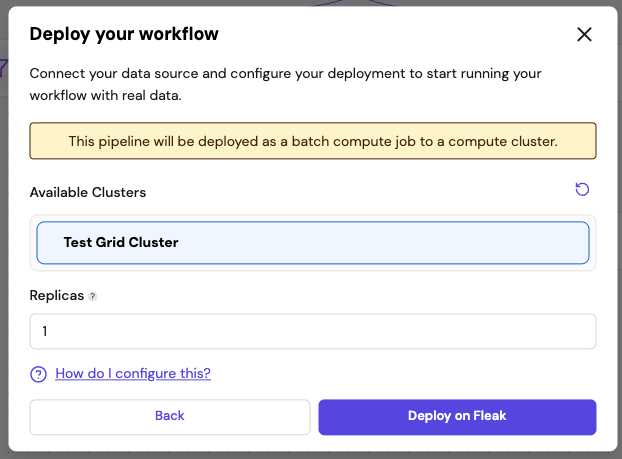
5.3 Configure Compute and Schedule
- Available Clusters — select the compute cluster to run the workflow on
- Replicas — set the number of parallel replicas (default 1)
- Schedule trigger (batch workflows only) — configure when the workflow runs. Select a preset (hourly, daily, weekly, monthly) or enter a custom cron expression. Choose a timezone for the schedule. Streaming workflows run continuously as soon as deployed and do not require a schedule.
Click Deploy on Fleak to submit.
5.4 Deployment Confirmation
After a successful deployment, a confirmation dialog shows the deployment details including the cluster, replicas, frequency, first run time, and version hash.
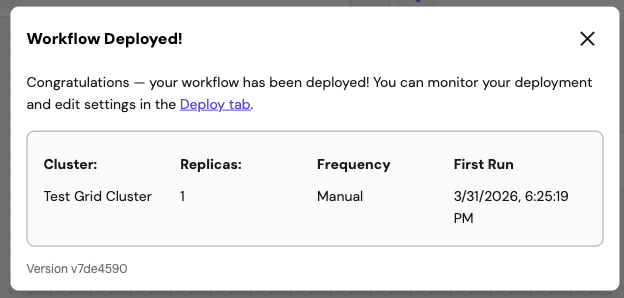
Any previously active deployment for this workflow is automatically stopped and replaced.