Job Submission
Learn how to submit and manage jobs in Grid's on-premises deployment using the JobMaster UI. This guide covers accessing the interface, viewing cluster capacity, submitting DAG configurations, and monitoring job execution.
Accessing the JobMaster UI
Grid's on-premises deployment includes a web-based interface for job submission and management. The JobMaster service runs on port 9527 and can be accessed locally using Kubernetes port forwarding.
Expose JobMaster Locally
Use kubectl port-forward to access the JobMaster UI from your local machine:
kubectl port-forward -n <namespace> svc/grid-jobmaster 9527:9527
Replace <namespace> with your Grid deployment namespace (typically grid or default).
Example:
# For Grid deployed in the 'grid' namespace
kubectl port-forward -n grid svc/grid-jobmaster 9527:9527

# For Grid in the default namespace
kubectl port-forward svc/grid-jobmaster 9527:9527
Output:
Forwarding from 127.0.0.1:9527 -> 9527
Forwarding from [::1]:9527 -> 9527
Keep the terminal window open while using the UI. Closing the terminal or pressing Ctrl+C will stop the port forwarding.
Access the UI in Browser
Once port forwarding is active, open your browser and navigate to:
http://localhost:9527
The JobMaster UI provides three main views:
- Cluster View - Monitor worker capacity and health
- Submit Job - Upload and submit DAG configurations
- Jobs View - Monitor and manage submitted jobs
Cluster View
The Cluster View displays all available workers in your Grid deployment and their current capacity. This helps you understand the compute resources available before submitting jobs.
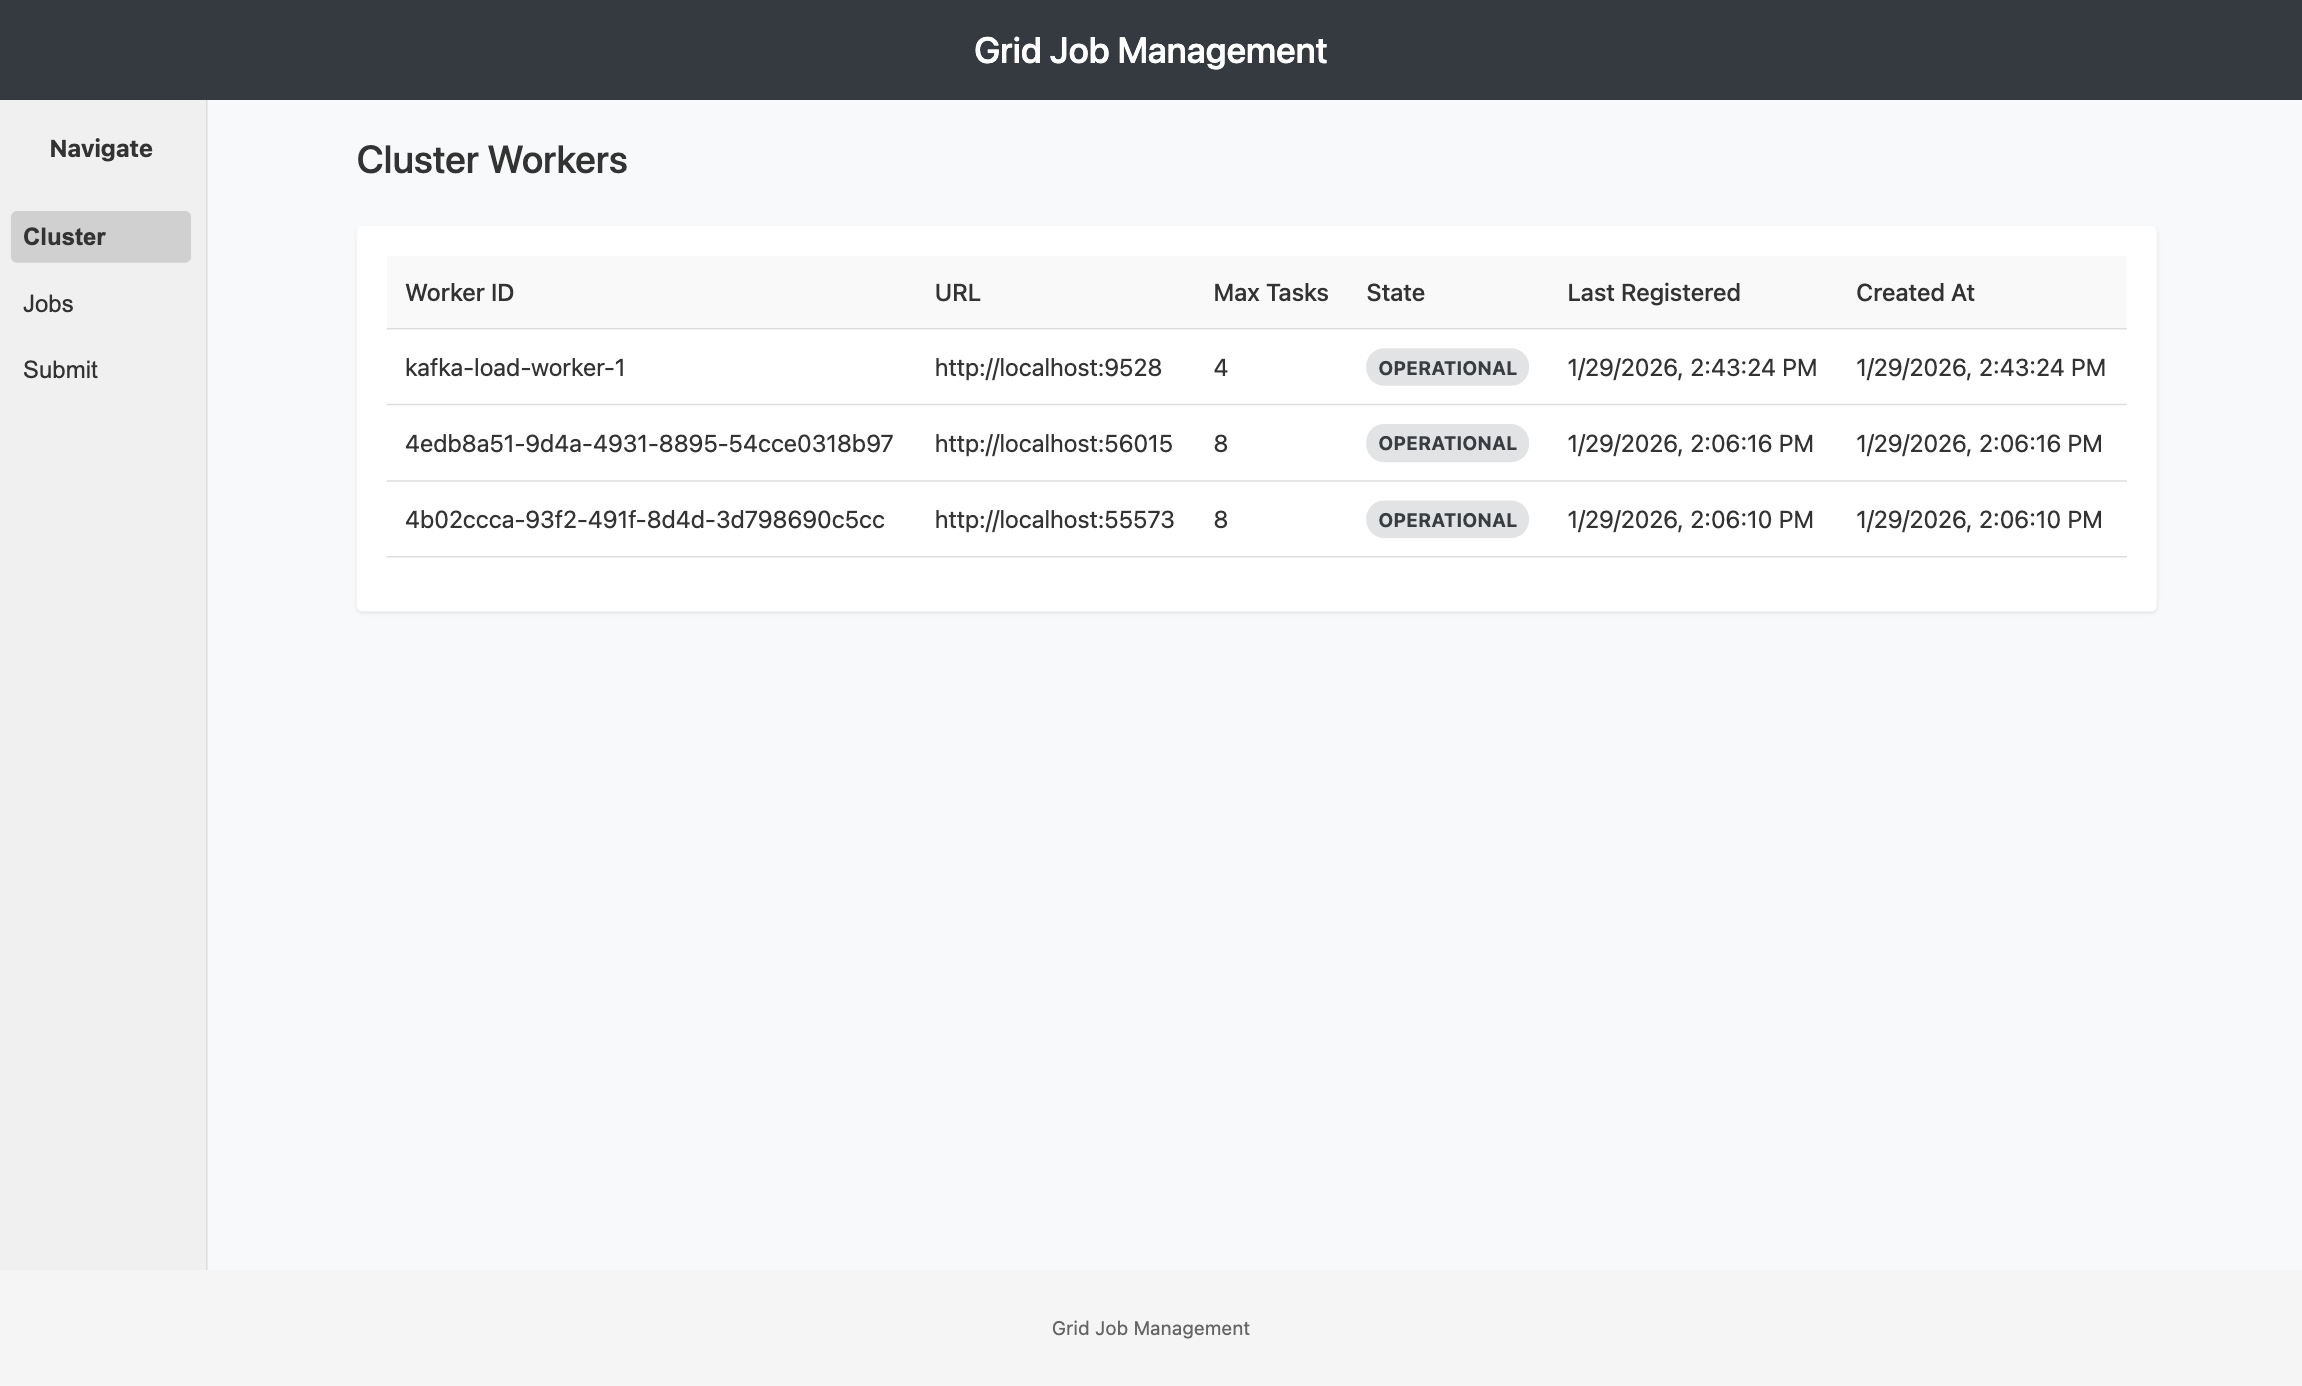
Worker Information
Each worker displays:
- Worker ID: Unique identifier for the worker instance
- Worker URL: Network endpoint for the worker service
- Task Max: Maximum number of concurrent tasks the worker can handle
- Status: Worker state indicator
- OPERATIONAL: Worker is healthy and accepting tasks
- UNSTABLE: Worker is experiencing intermittent issues
- MAXED: Worker has reached its task capacity limit
- DOWN: Worker is not responding to heartbeats
- Last Registered: Timestamp of the most recent heartbeat
- Created At: When the worker first joined the cluster
Capacity Planning
Use the cluster view to:
- Verify worker availability before submitting large jobs
- Check capacity utilization to understand current load
- Identify unhealthy workers that may need attention
- Plan job parallelism based on available worker slots
Example Calculation: If you have 3 workers with a task max of 10 each, your cluster can run up to 30 concurrent tasks. If current utilization shows 20 tasks running, you have 10 slots available.
Worker capacity is configurable via Helm values. Adjust worker.task.max based on worker resource limits (CPU/memory).
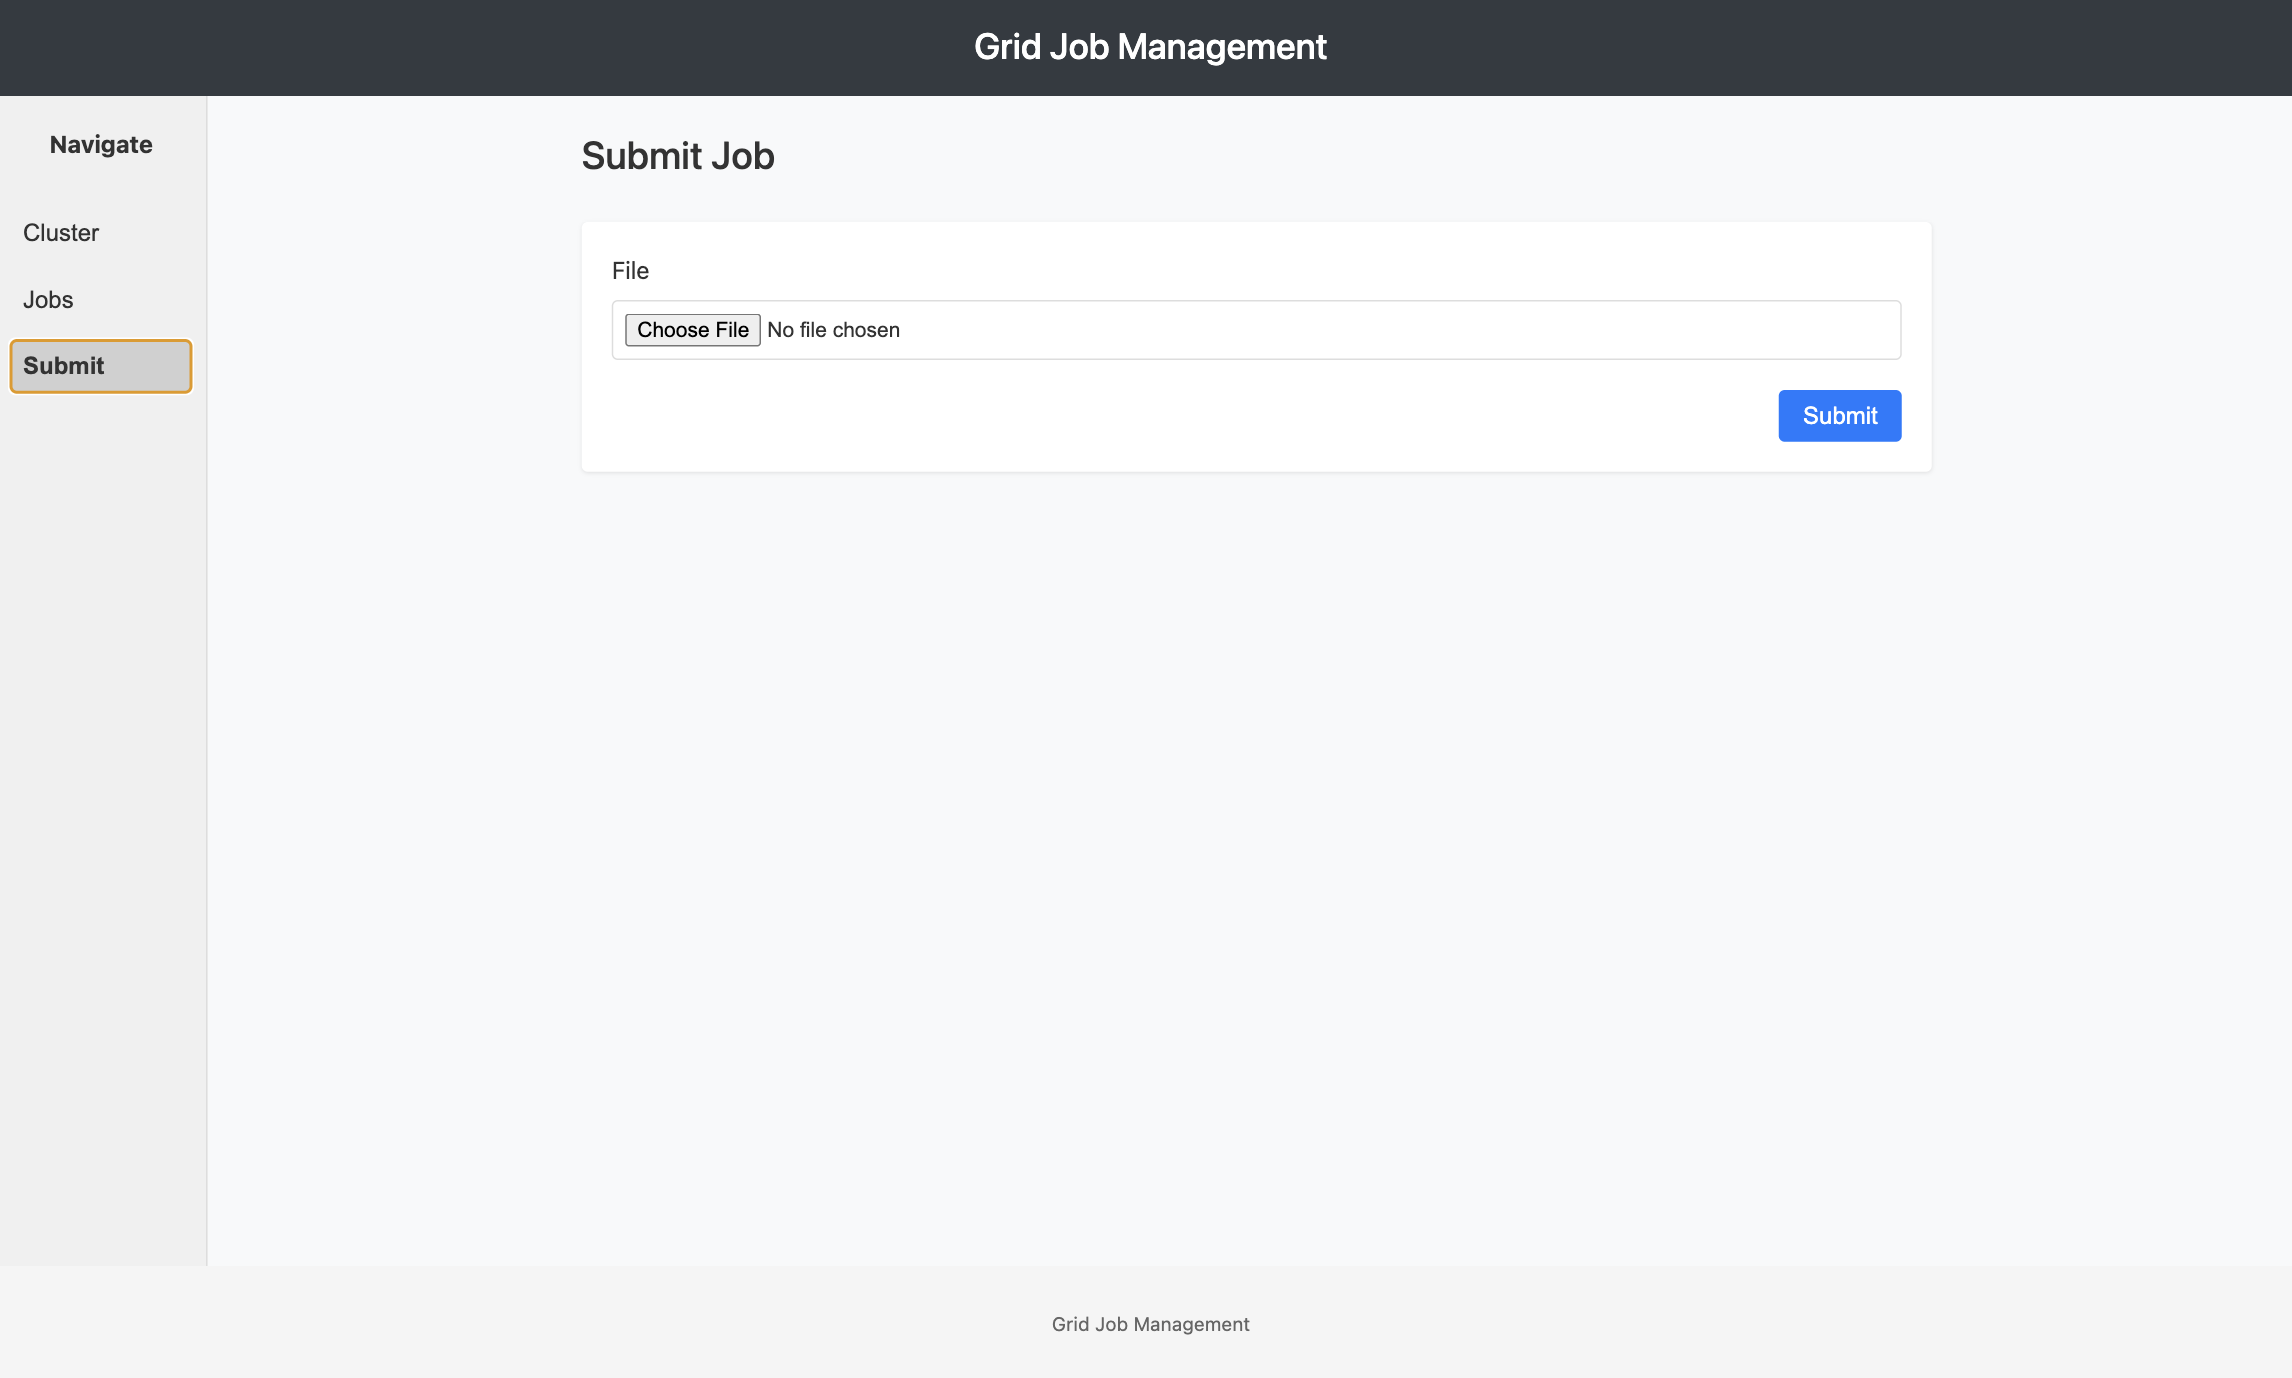
Submit Job View
The Submit Job view allows you to upload and execute DAG (Directed Acyclic Graph) configuration files. Grid processes these DAG files to create distributed data pipeline jobs.
Submitting a DAG File
Step 1: Prepare Your DAG Configuration
Create a DAG file defining your data pipeline.
Step 2: Upload the DAG File
- Click the "Choose File" or "Browse" button
- Select your DAG YAML file (
.yamlor.yml) from your local filesystem - The filename will appear next to the button
Step 3: Submit the Job
- Click the "Submit" button
- Grid will validate the DAG configuration
- If valid, the job is queued and you'll receive a Job ID
- If invalid, an error message displays with details
Step 4: Confirmation
Upon successful submission, you'll see:
- A success message with the Job ID
- The job appears in the Jobs View
- Tasks are automatically scheduled to available workers
Jobs View
The Jobs View displays all submitted jobs with their current status and task breakdowns. This is your primary interface for monitoring job execution.
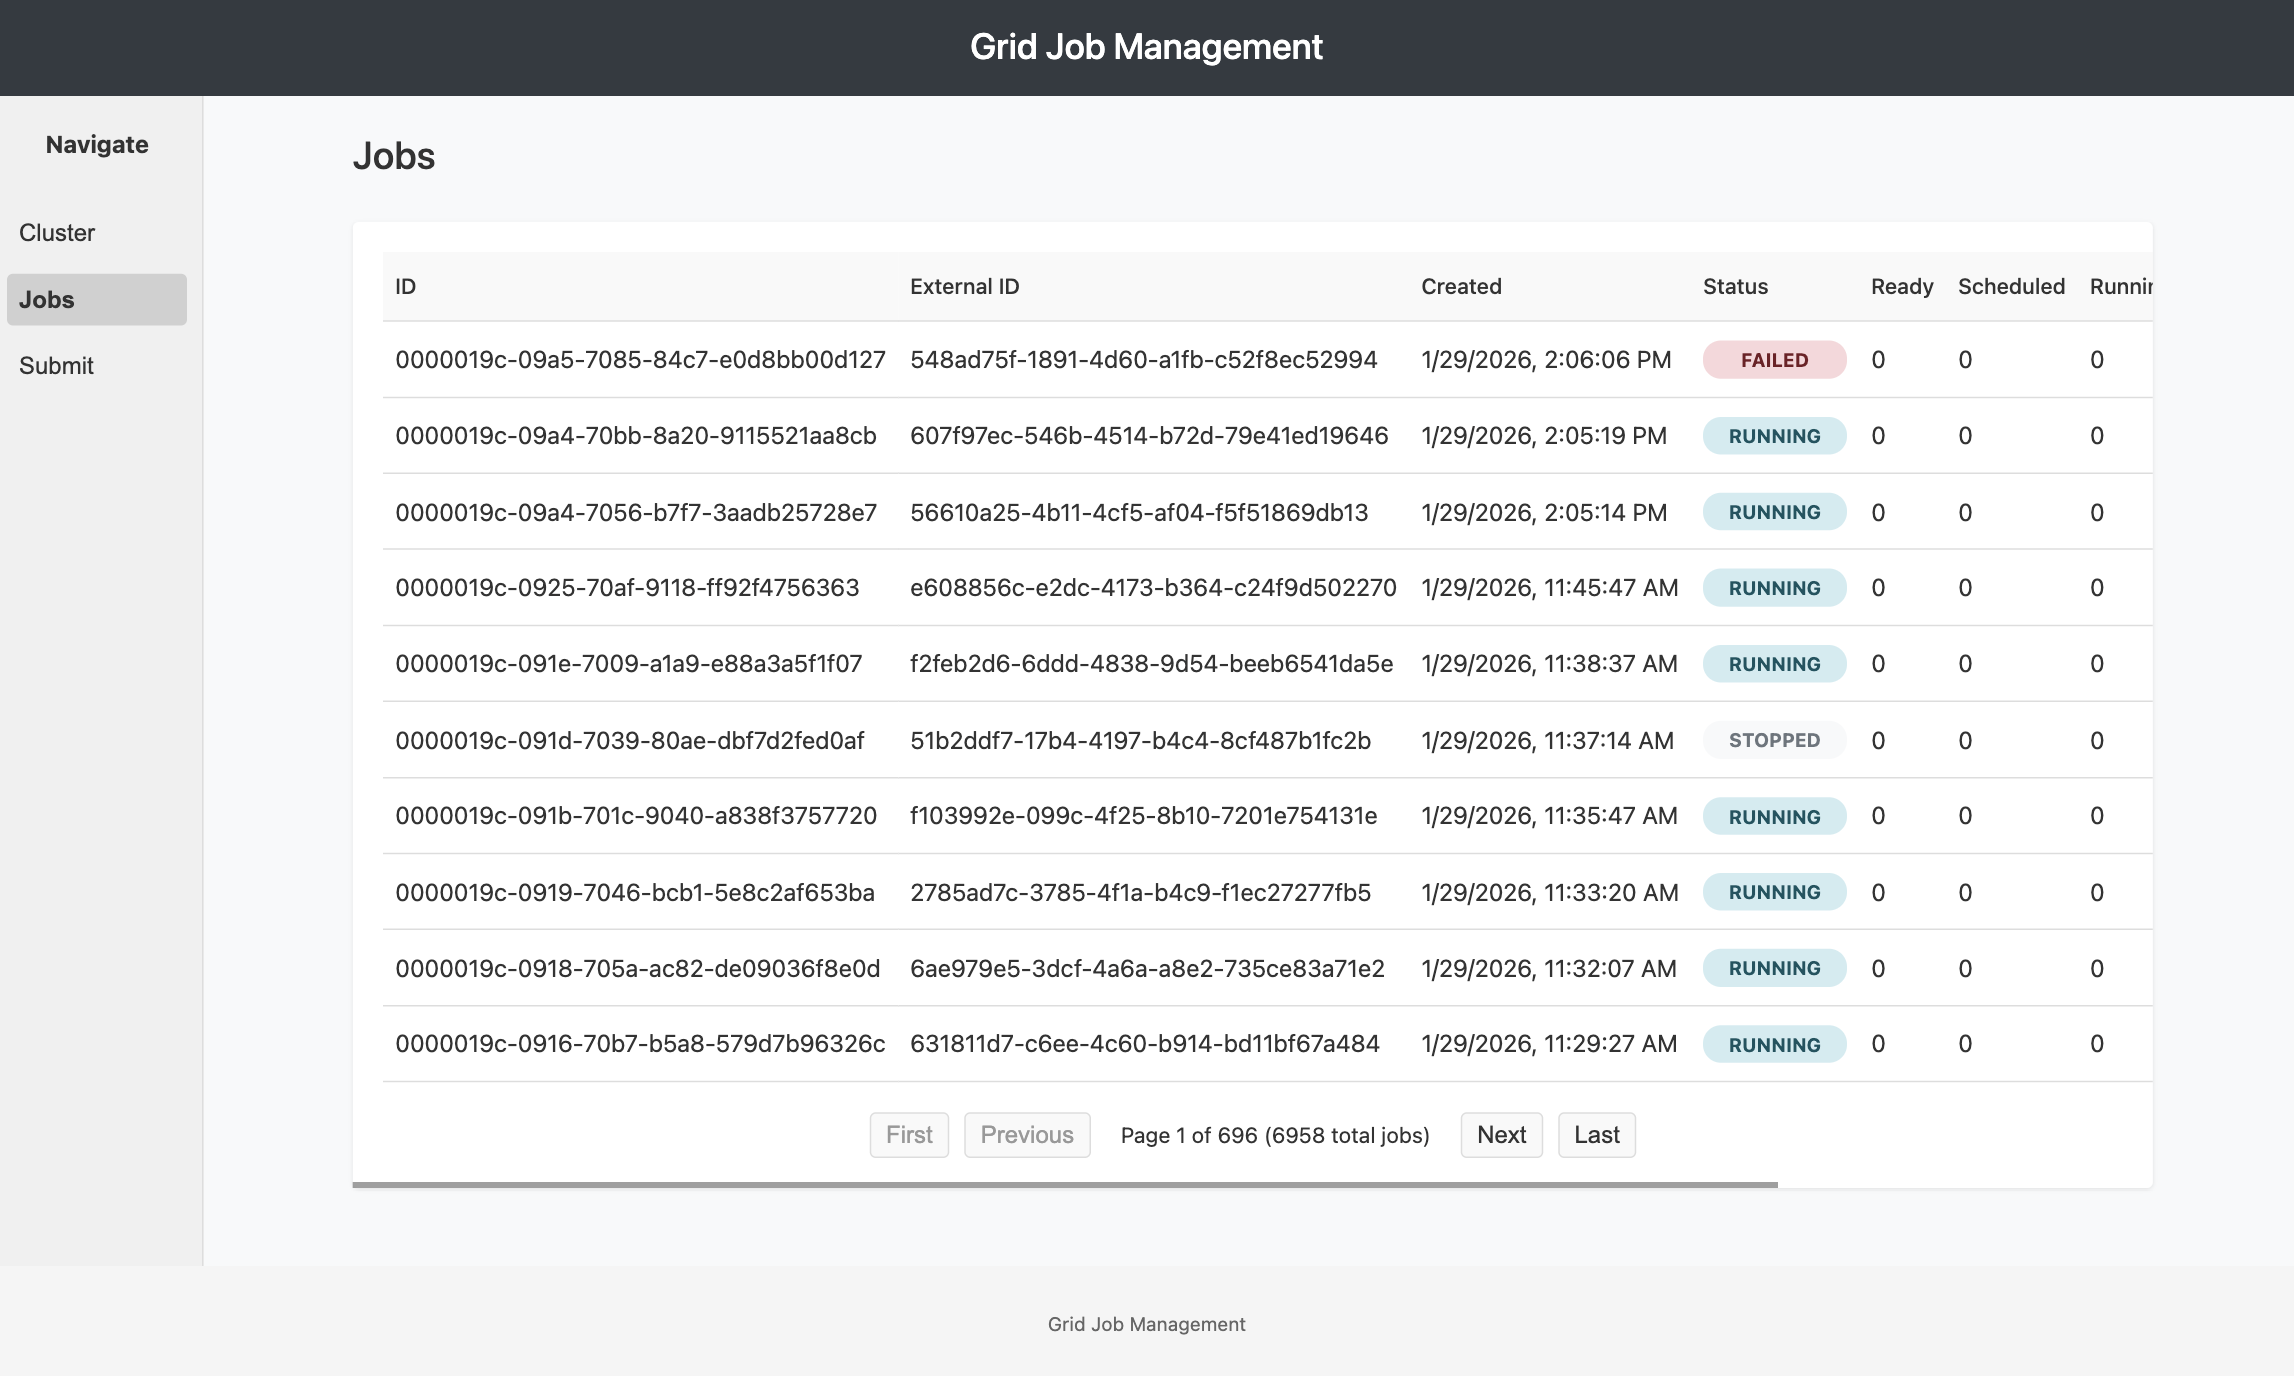
Job List
Each job entry shows:
- Job ID: Unique Grid-assigned identifier (a UUID, e.g.,
018f9a2b-1c3d-7e4f-8a9b-0c1d2e3f4a5b) - External ID: Your custom identifier (if provided during submission)
- Status Badge: Color-coded job state
- RUNNING (blue): Job has active tasks (ready, scheduled, or running) and no failures
- COMPLETED (green): All tasks finished successfully
- FAILED (red): Tasks failed and none are still active
- PARTIAL_FAILURE (amber): Some tasks failed while others are still active
- TIMEOUT (amber): Tasks exceeded their schedule or run time limits
- MIXED (gray): Task states don't fall into any other category
- EMPTY (gray): Job has no tasks
- Task Counters: Breakdown of task states
- Ready: Tasks queued, waiting for worker assignment
- Scheduled: Tasks assigned to workers but not started
- Running: Tasks currently executing
- Completed: Successfully finished tasks
- Failed: Tasks that encountered errors
- Schedule Timeout: Tasks that timed out waiting for worker assignment
- Run Timeout: Tasks that exceeded their maximum runtime
- Created At: Job submission timestamp
Filtering and Sorting
Search:
- Filter jobs by Job ID or External ID
- Use the search box at the top of the list
Sort:
- Default: Most recent jobs first
- Click column headers to sort by different fields
Pagination:
- Navigate through pages if you have many jobs
- Pages show up to 10 jobs each
Job Actions
From the Job List:
- View Details: Click on a job row to open the detailed view
Job and per-task termination actions are available in the Job Detail View.
Job Detail View
Click on any job in the Jobs View to access detailed information about its execution. The Job Detail View provides comprehensive insights into individual job performance.
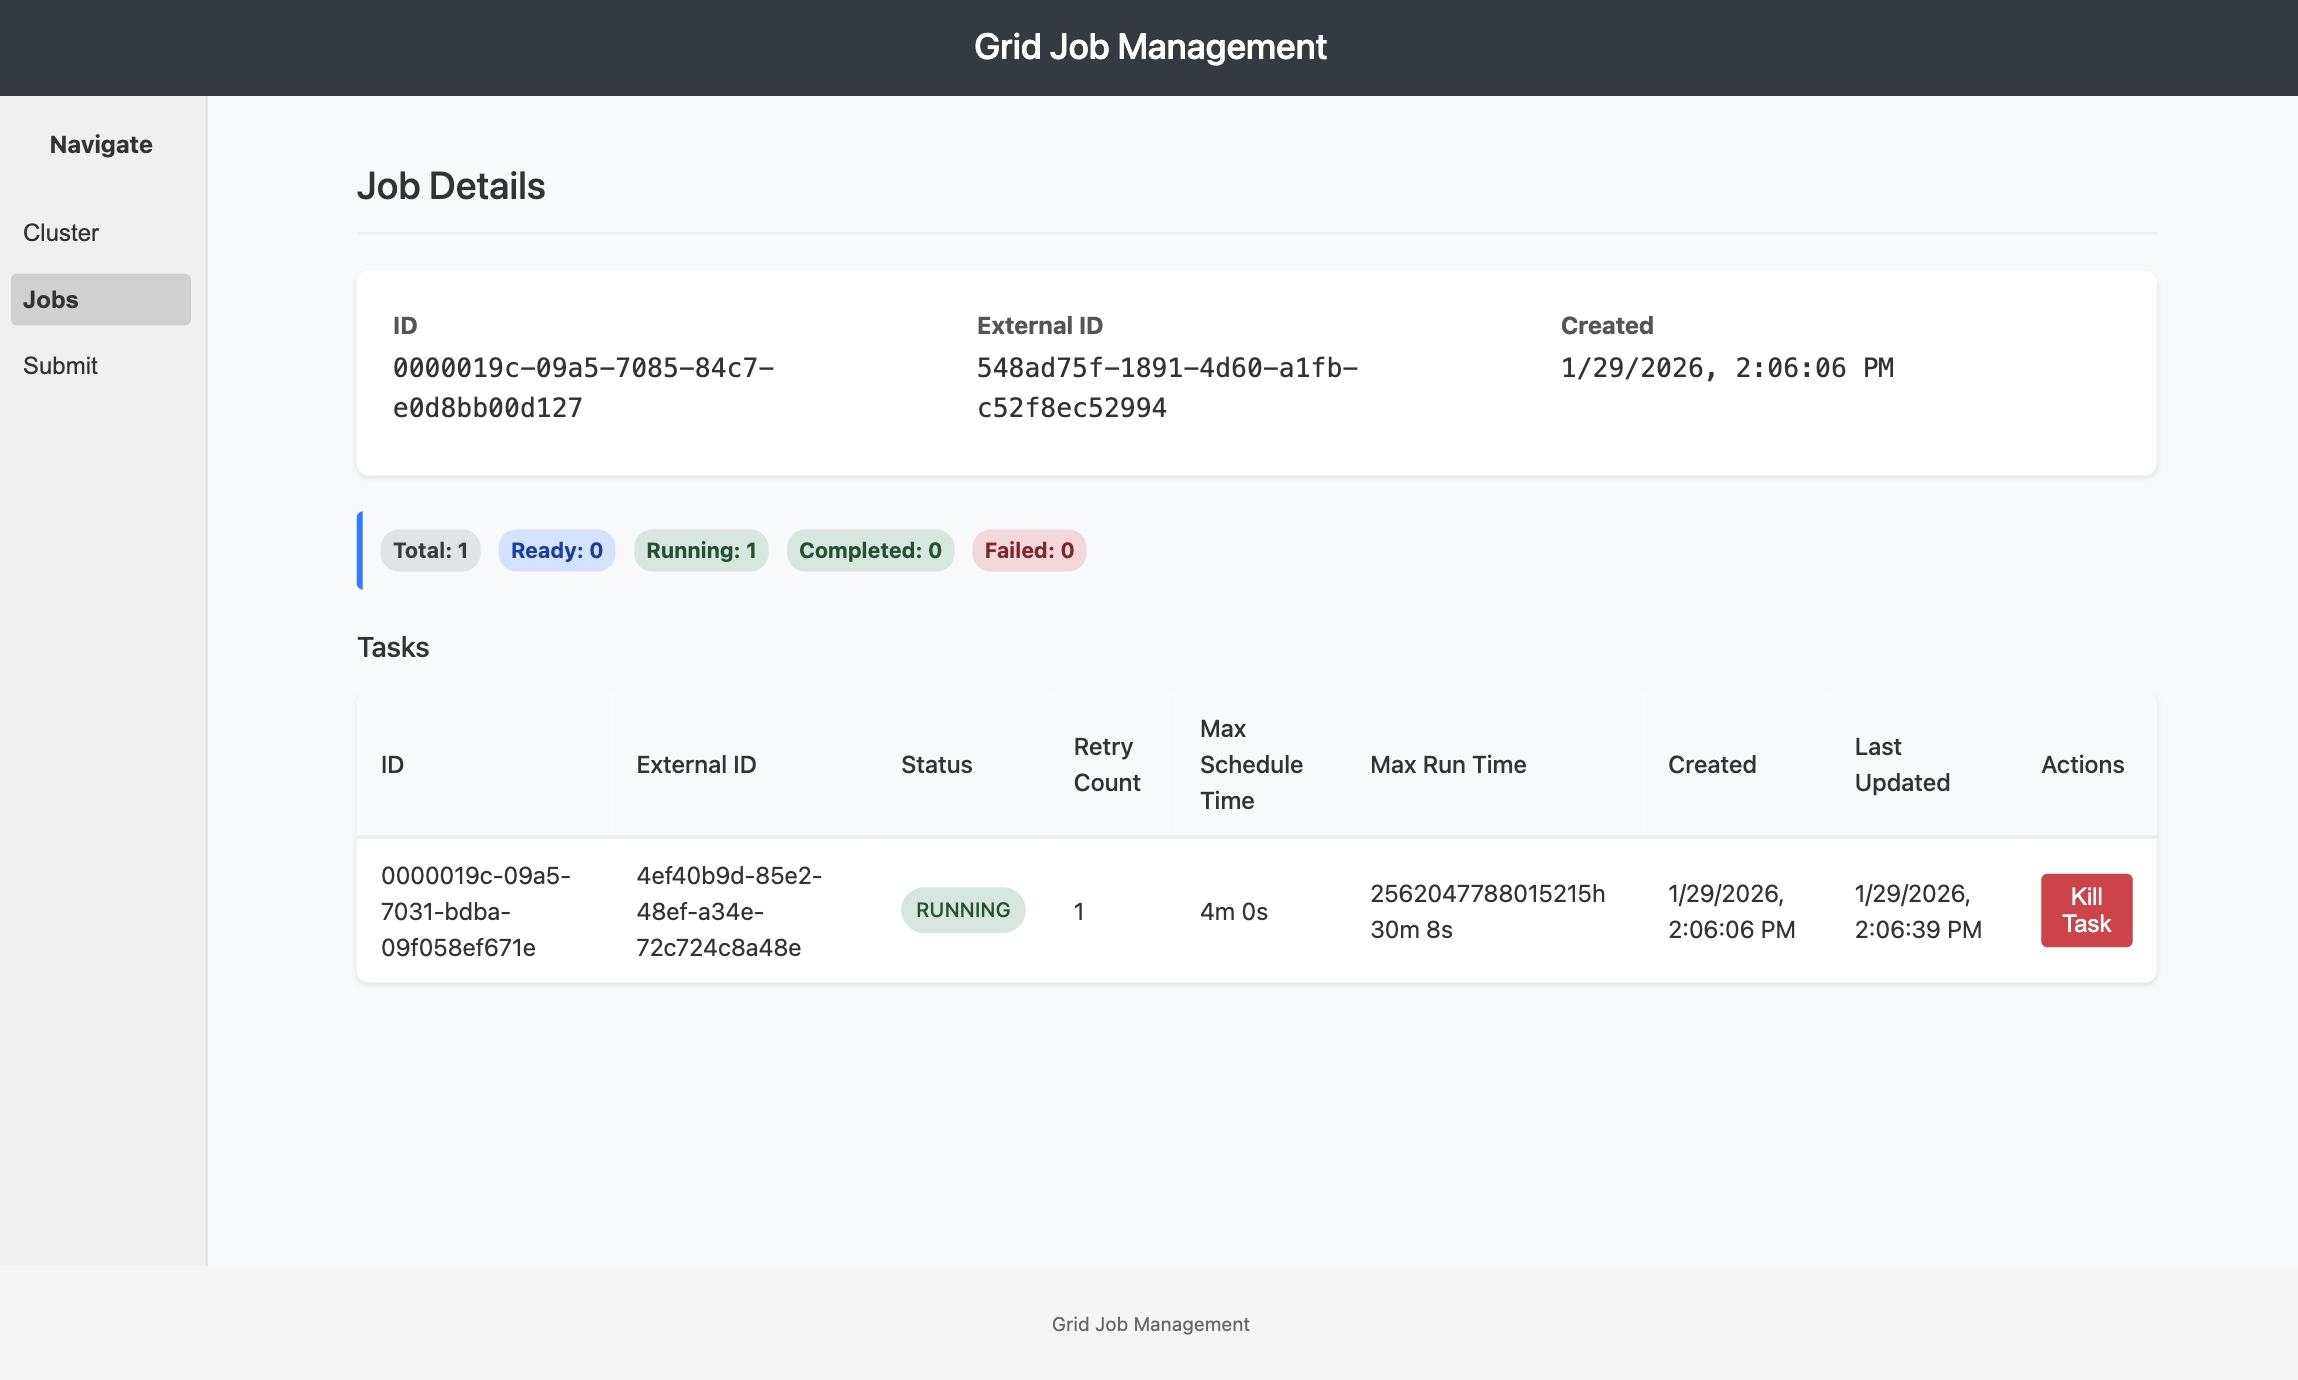
Job Summary
The top section displays aggregated job information:
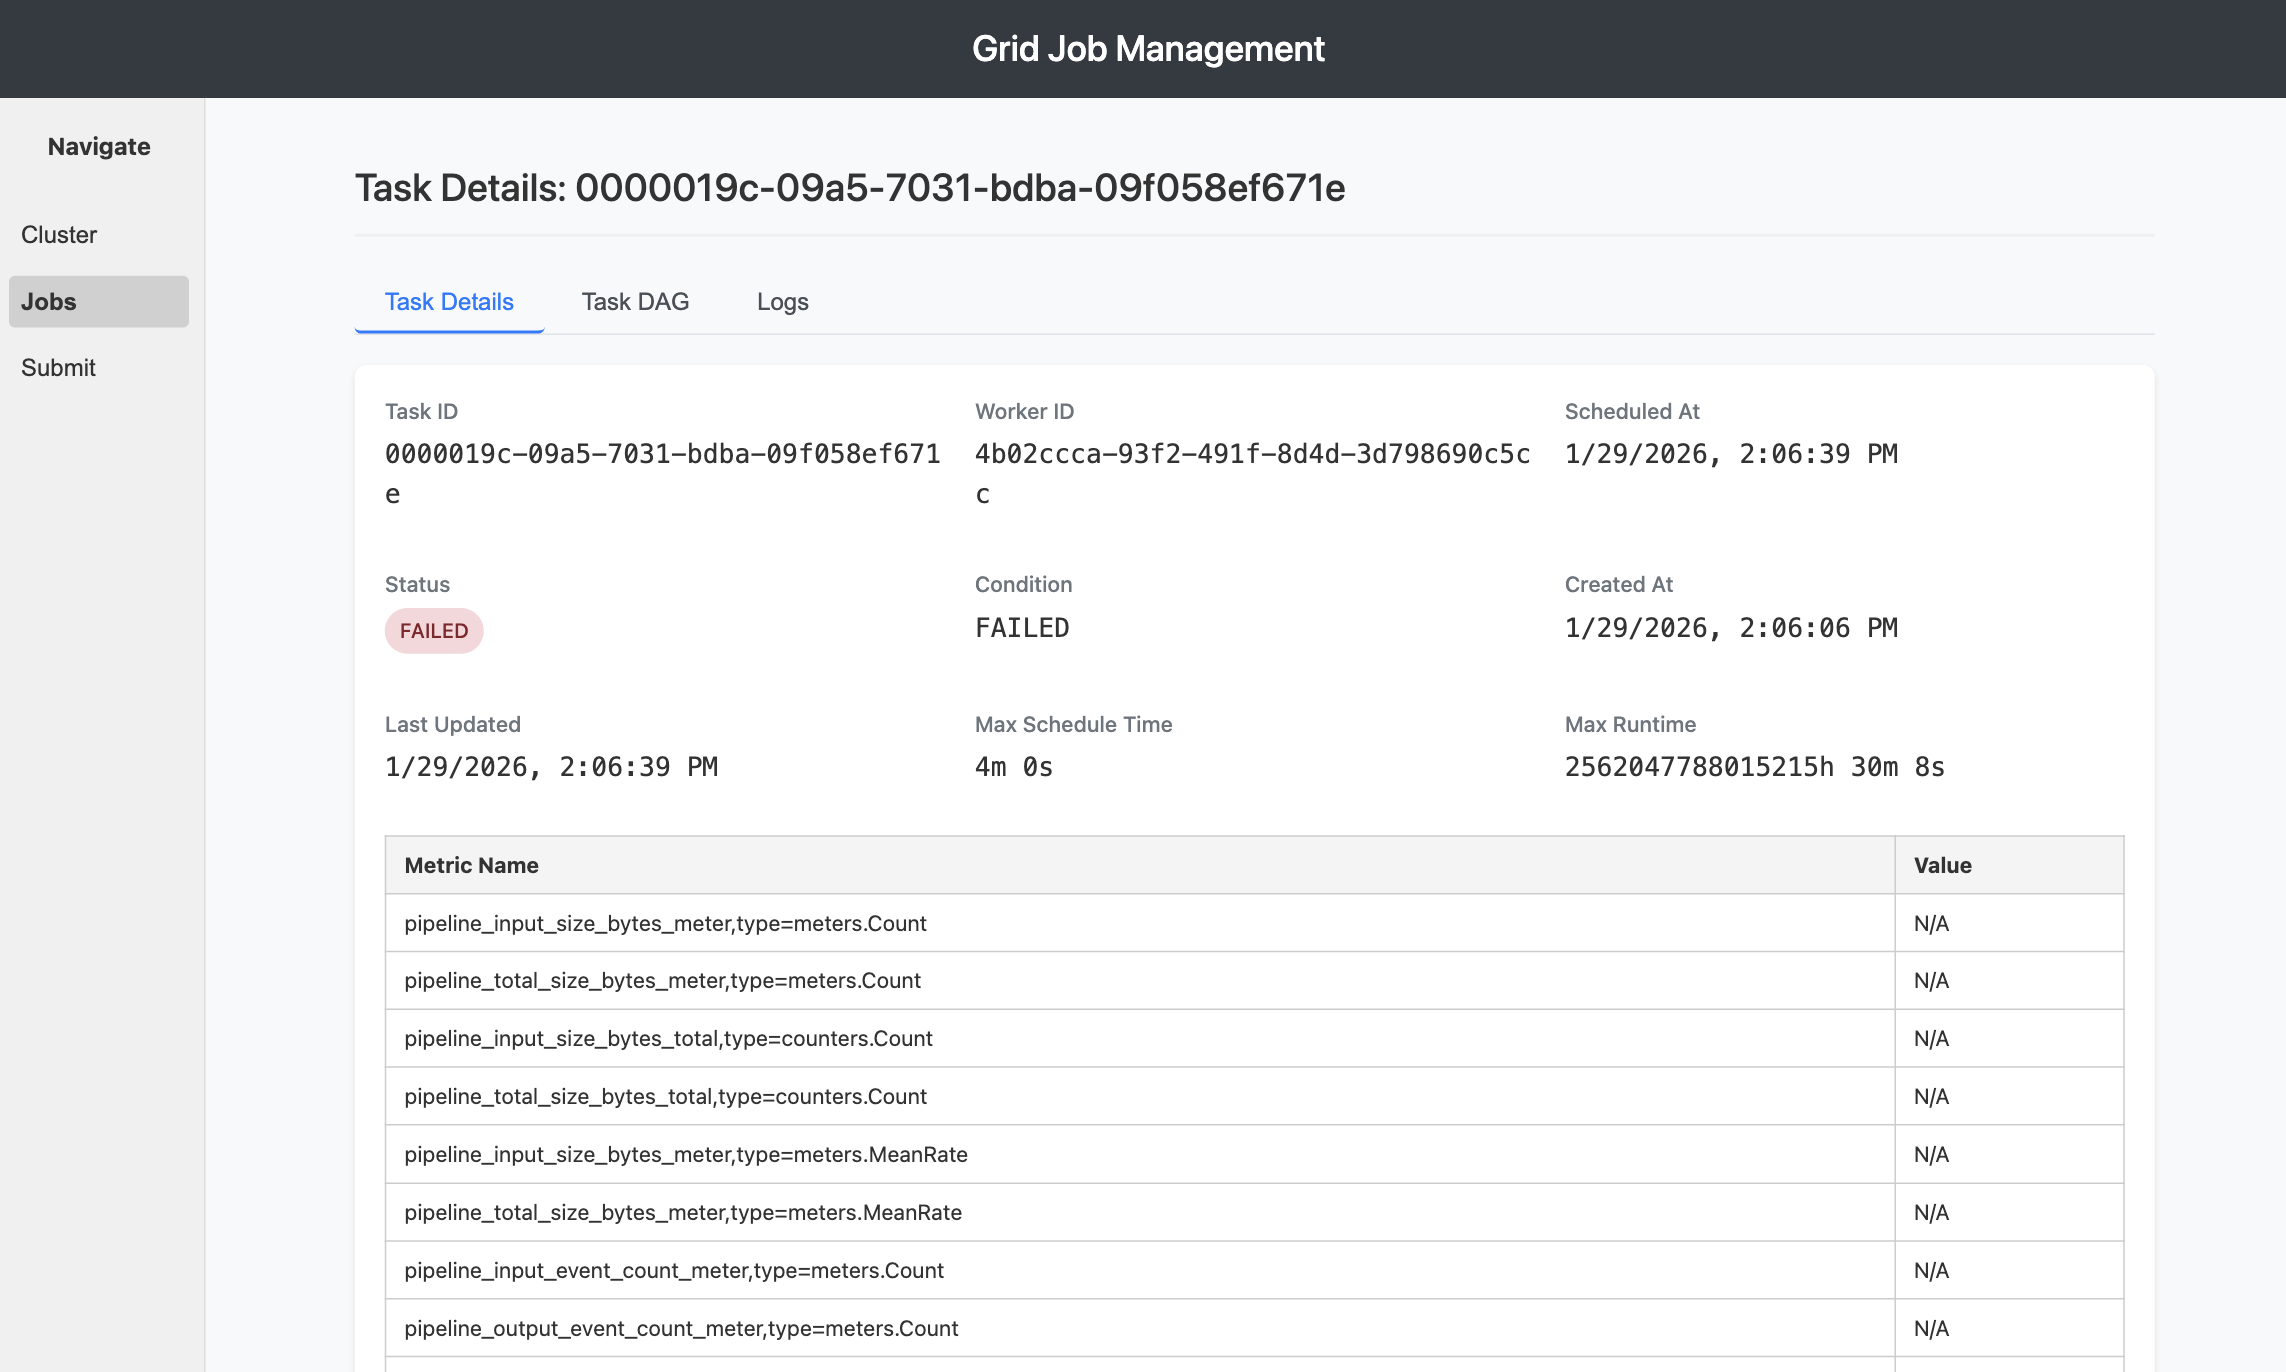
Status Overview:
- Job ID and External ID
- Creation timestamp
Task Distribution: Task state breakdown with counts and visual indicators:
- Ready: Tasks in queue
- Scheduled: Tasks assigned to workers
- Running: Tasks actively executing
- Completed: Successfully finished tasks
- Failed: Tasks with errors
- Schedule Timeout: Tasks that timed out waiting for scheduling
- Run Timeout: Tasks that exceeded their maximum runtime
Job-Level Actions
Stop Job: Terminates all running tasks in the job and prevents retries:
- Click the "Stop Job" button at the top
- Confirm the action in the dialog
- All non-terminal tasks transition to COMPLETED state
- Job task counters update accordingly
Use Cases for Killing Jobs:
- Job is processing incorrect data
- Pipeline configuration needs to be changed
- Resource constraints require stopping work
- Development/testing iterations
Stopping a job is not reversible. Tasks that were in progress will be terminated and marked as completed. Only stop jobs when necessary.
Real-Time Updates
The Job Detail View automatically refreshes every 10 seconds to show:
- Task state changes
- New task completions
- Error updates
- Duration calculations
You can manually refresh by reloading the page.
Best Practices
Before Submission
Test Your DAG:
- Start with a small sample of data
- Verify all node configurations are correct
- Test connections to external systems (Kafka, databases)
Right-Size Your Job:
- Match parallelism to cluster capacity
- Avoid over-subscribing worker capacity
- Consider data volume and processing time
Use External IDs:
- Always provide meaningful external IDs
- Makes correlation with your system easier
- Simplifies job tracking and auditing
During Execution
Monitor Actively:
- Watch the first few tasks complete successfully
- Check logs early to catch configuration issues
- Monitor resource usage in Kubernetes
Don't Over-Kill:
- Let automatic retries handle transient errors
- Only kill jobs for unrecoverable issues
- Consider killing and resubmitting for config errors
After Completion
Review Metrics:
- Check task execution times
- Identify slow nodes in the pipeline
- Look for optimization opportunities
Clean Up:
- Archive or delete old completed jobs
- Free up database storage
- Maintain job history for auditing
Troubleshooting
Cannot Access JobMaster UI
Symptom: Browser shows "Connection refused" at http://localhost:9527
Solutions:
- Verify port forwarding is active (check terminal window)
- Confirm JobMaster pod is running:
kubectl get pods -n <namespace> | grep jobmaster - Check JobMaster service exists:
kubectl get svc -n <namespace> | grep jobmaster - Verify correct namespace in port-forward command
Job Submission Fails
Symptom: Error message after clicking "Submit Job"
Solutions:
- Validate DAG syntax
- Check error message for specific validation failures
- Verify all node types are supported by your Grid version
- Ensure source and sink nodes are present
- Check for circular dependencies in edges
Tasks Stuck in READY State
Symptom: Tasks never transition to SCHEDULED or RUNNING
Solutions:
- Check Cluster View for available workers
- Verify workers are in OPERATIONAL state
- Scale up worker replicas if capacity is full:
kubectl scale deployment grid-worker -n <namespace> --replicas=5 - Check TaskScheduleMonitor logs for errors
High Task Failure Rate
Symptom: Many tasks in FAILED state
Solutions:
- Click on a failed task to view logs
- Check for common error patterns
- Verify external service connectivity (Kafka, databases)
- Review node configurations for errors
- Check worker resource limits (CPU/memory)
For additional support with job submission or troubleshooting, contact support@fleak.ai